43.Istio安装配置
文章目录
1. Istio简介
1.1.参考资料
https://www.jianshu.com/p/8104194ff6fd
https://blog.csdn.net/chenleiking/article/details/79785493
https://yq.aliyun.com/articles/629013
https://istio.io/zh/docs/
http://blog.daocloud.io/where-is-the-request-1/
https://www.yangcs.net/
https://www.yangcs.net/posts/istio-traffic-management-impl-intro/
https://www.jianshu.com/p/7ac4f1de21dd
https://istio.io/zh/docs/reference/config/istio.networking.v1alpha3/
https://blog.csdn.net/Ybt_c_index/article/details/81034971
https://istio.io/zh/blog/2018/v1alpha3-routing/
https://www.cnblogs.com/mathli/archive/2018/11/13/9952483.html
http://www.servicemesher.com/
###1.5.0之后,做了重构###
https://istio.io/docs/reference/commands/operator/
https://istio.io/docs/reference/config/istio.operator.v1alpha1/
https://istio.io/docs/reference/config/istio.operator.v1alpha1/#KubernetesResourcesSpec
https://mp.weixin.qq.com/s/WjiKUSSnxQhgs-t4eJ0CVw
1.2.架构说明(1.5.0做了重构)
Istio主要由Envoy.Pilot.Mixer.Citadel四部分组成,整体结构如下:
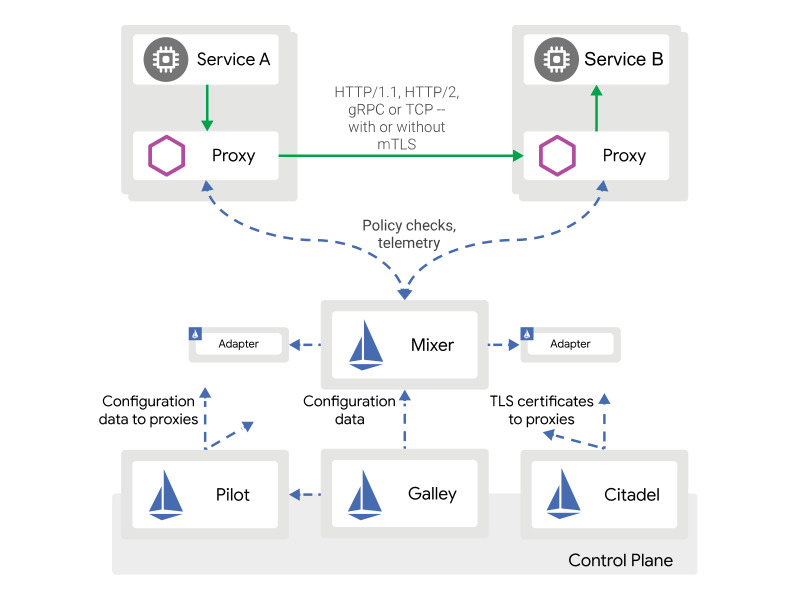
Envoy:动态服务获取,负载平衡,路由,断路器,超时,指标上报.
Mixer (https://istio.io/docs/concepts/policies-and-telemetry/overview/):指标收集,对接外部组件(Prometheus,Fluentd,Jaeger)
Pilot (https://istio.io/docs/concepts/traffic-management/pilot/):注册中心,配置中心
Citadel (https://istio.io/docs/concepts/security/):安全中心
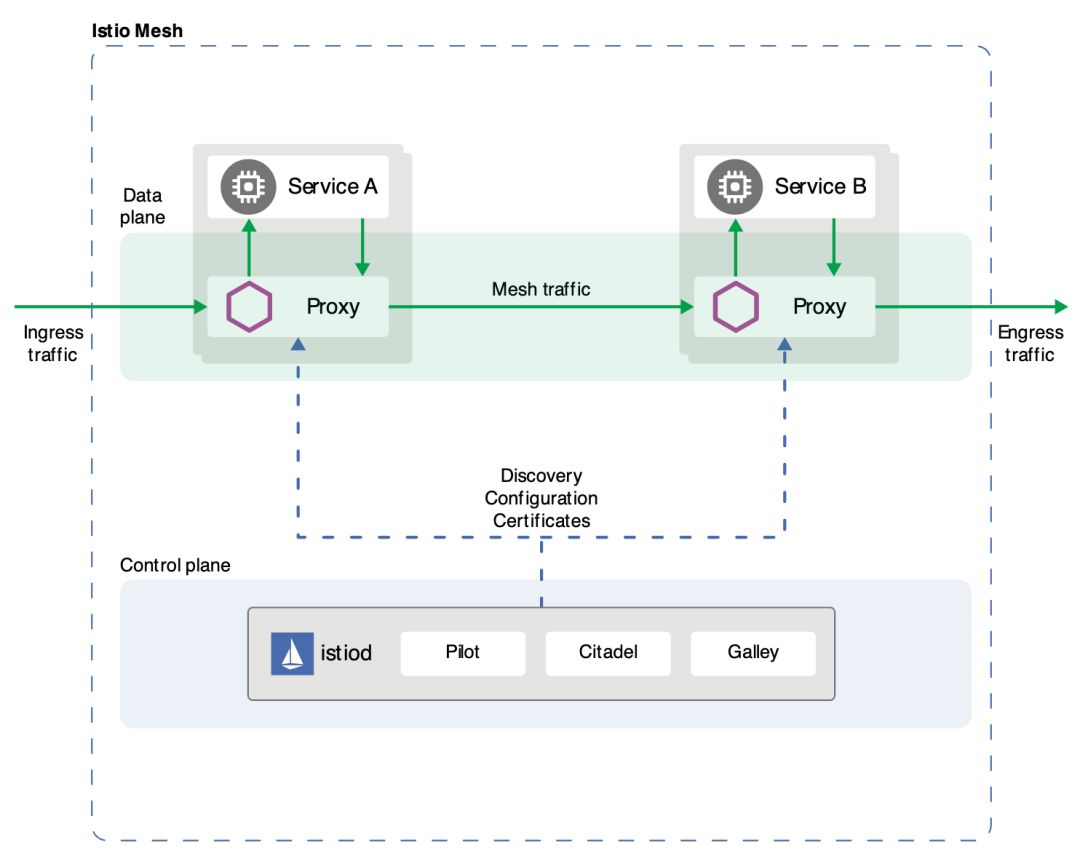
1.5.0之后,新的架构图如下
1.3.Envoy
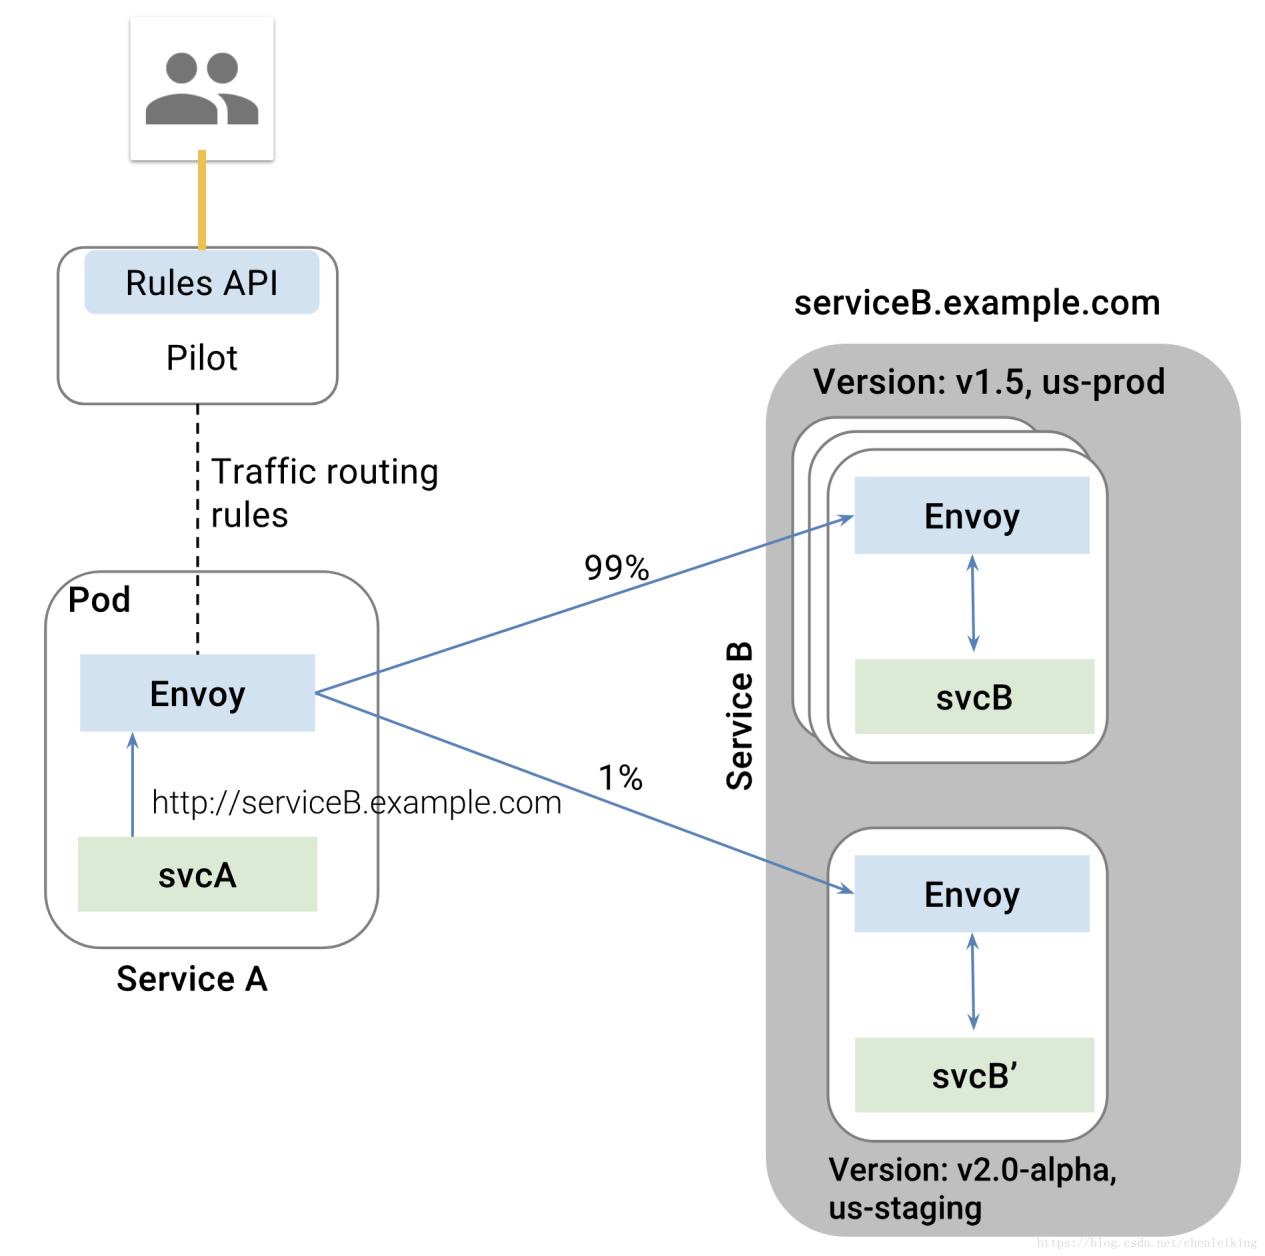
svcA服务作为客户端点用服务端svcB,svcB存在有两个版本,但是svcA并不知情
Envoy作为sidecar部署到各个svc到pod内,代理所有到进出流量
当svcA通过svcB到域名访问其服务时,Envoy根据Pilot配置的路由规则,将1%的流量分给了svcB的alpha版本
整个过程对应用程序透明,无需任何的代码修改.
1.4.Mixer(1.5之后,逐渐淘汰)
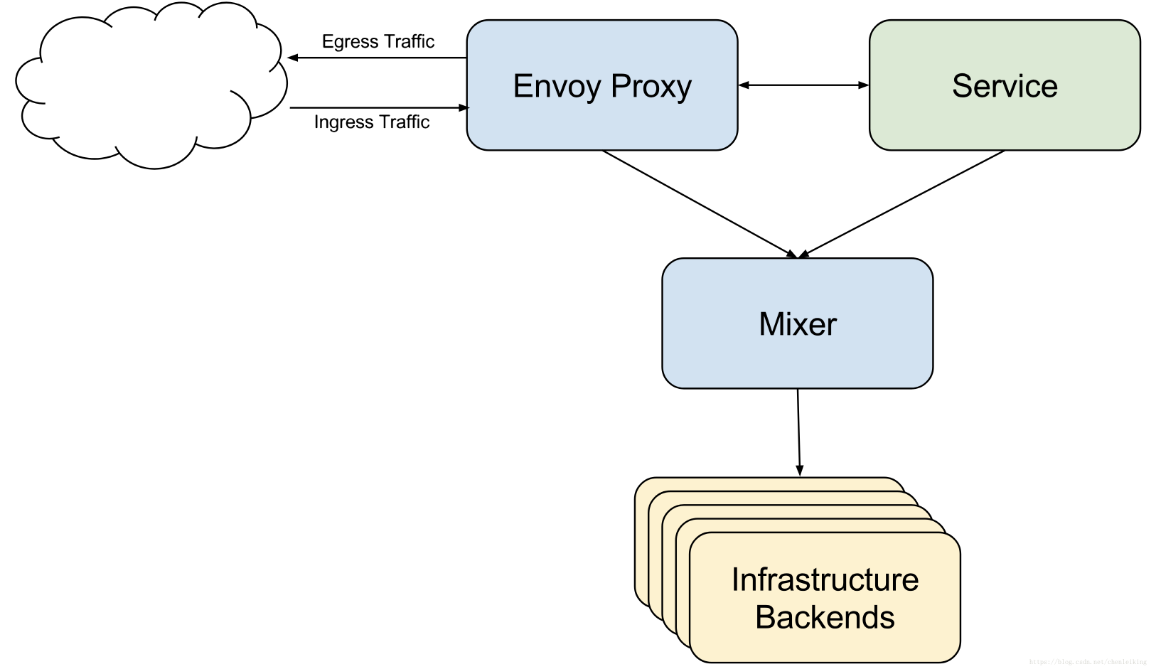
Mixer主要提供三个核心功能:
-
前提条件检查:发生在服务响应请求之前,如果检查不通过可终止响应
-
配额管理:
-
遥测报告:可监控服务.上报日志信息
1.5.Pilot
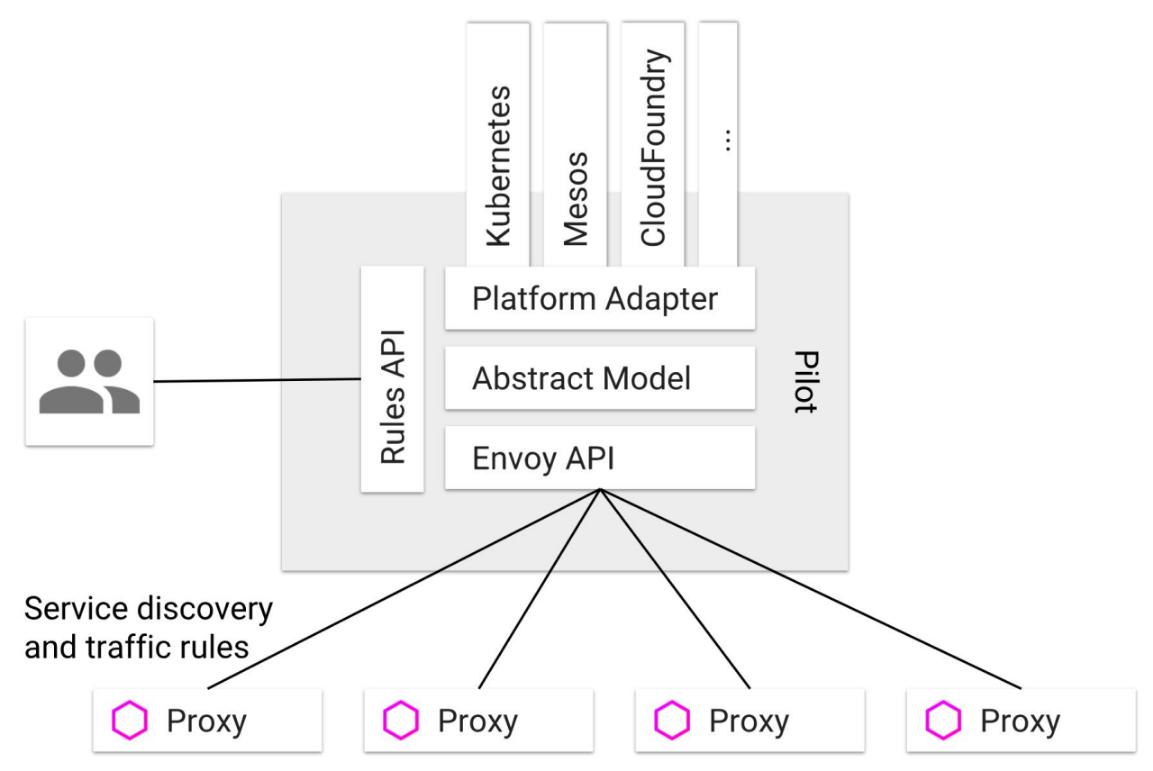
这张图表明了Pilot平台无关性设计,Pilot提供REST客户端接受用户请求,具体的实现则由各个平台自己实现Platform Adapter.Envoy同样实现EnvoyAPI以实现路由配置功能和服务发现功能.
通过配置,Pilot可以使Envoy实现:路由配置.故障注入.流量迁移.请求超时.熔断等诸多能力.
统一的服务模型
Pilot定义了网格中服务的标准模型,这个标准模型独立于各种底层平台.由于有了该标准模型,各个不同的平台可以通过适配器和Pilot对接,将自己特有的服务数据格式转换为标准格式,填充到Pilot的标准模型中.
例如Pilot中的Kubernetes适配器通过KubernetesAPI服务器得到kubernetes中service和pod的相关信息,然后翻译为标准模型提供给Pilot使用.通过适配器模式,Pilot还可以从Mesos,CloudFoundry,Consul等平台中获取服务信息,还可以开发适配器将其他提供服务发现的组件集成到Pilot中.
标准数据平面API
Pilot使用了一套起源于Envoy项目的标准数据平面API来将服务信息和流量规则下发到数据平面的sidecar中.通过采用该标准API,Istio将控制平面和数据平面进行了解耦,为多种数据平面sidecar实现提供了可能性.
业务DSL语言
Pilot还定义了一套DSL语言,提供了面向业务的高层抽象,可以被运维人员理解和使用.运维人员使用该DSL定义流量规则并下发到Pilot,这些规则被Pilot翻译成数据平面的配置,再通过标准API分发到Envoy实例,可以在运行期对微服务的流量进行控制和调整.
Pilot的规则DSL是采用APIServer中的[CustomResource(CRD)]实现的,因此和其他资源类型如Service,Pod和Deployment的创建和使用方法类似,都可以用Kubectl进行创建.
通过运用不同的流量规则,可以对网格中微服务进行精细化的流量控制,如按版本分流,断路器,故障注入,灰度发布等.
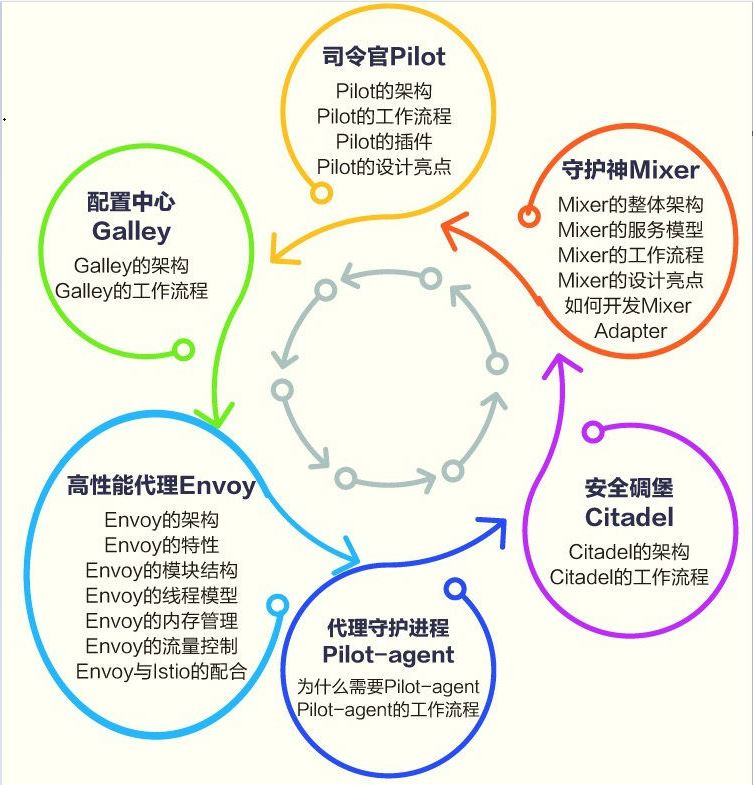
1.6.知识图谱
http://www.servicemesher.com/blog/istio-knowledge-map-v0.1-release/

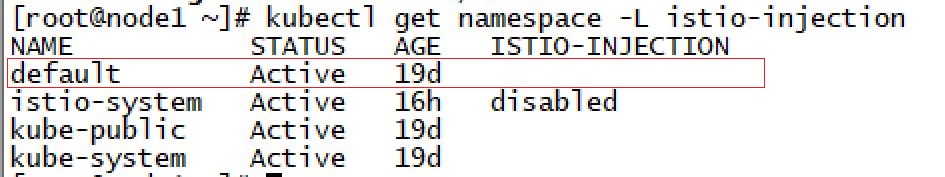
2. 下载安装
Istio会被安装到自己的istio-system命名空间,并且能够对所有其他命名空间的服务进行管理.
进入[Istio release]页面,下载对应目标操作系统的安装文件.在macOS或者Linux系统中,还可以运行下面的命令,进行下载和自动解压缩:
curl -L https://git.io/getLatestIstio | sh-
进入Istio包目录.假设这个包是istio-1.7.4:
cd istio-1.7.4
安装目录中包含:
在install/目录中包含了Kubernetes安装所需的.yaml文件
samples/目录中是示例应用
istioctl客户端文件保存在bin/目录之中.istioctl的功能是手工进行EnvoySidecar的注入,以及对路由规则.策略的管理
istio.VERSION配置文件
把istioctl客户端加入PATH环境变量,如果是macOS或者Linux,可以这样实现:
|
|
如果您的集群在不支持外部负载均衡器的环境中运行(例如minikube),istio-ingressgateway的EXTERNAL-IP将会显示为状态.您将需要使用服务的NodePort来访问,修改type类型为NodePort
kubectl edit svc istio-ingressgateway -n istio-system
nginx如果反向代理gateway的31380端口,需要设置
##proxy_redirect off;
proxy_http_version 1.1;
proxy_set_header Connection "";
不要使用upstream代理istio集群,Nginx需要使用最新的版本,1.14.2+,可能会造成文件加载大小异常,造成浏览器一直加载文件的部分内容,卡死.
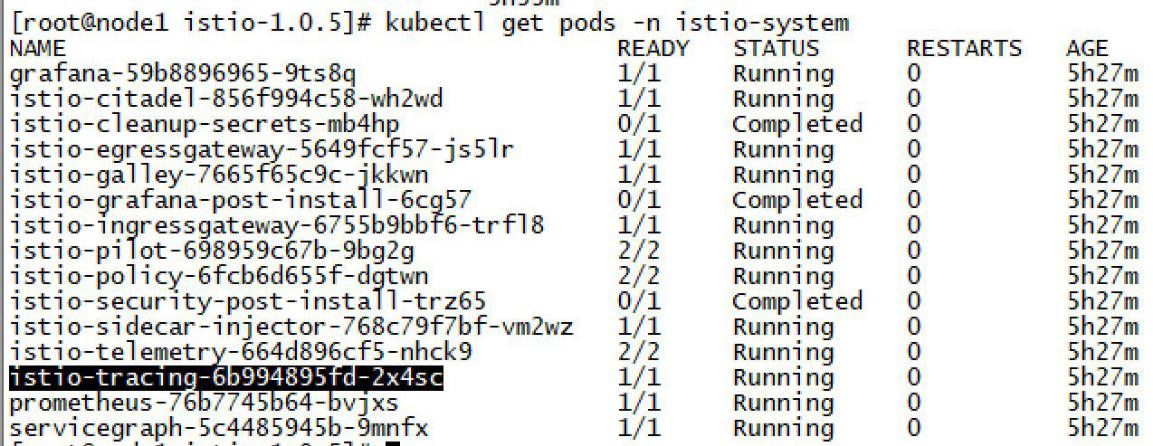
###查看pod状态###
kubectl get pods -n istio-system
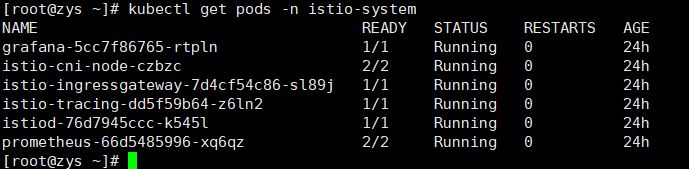
Job的状态是Completed,这个是正常的,job是一次性执行的.
3. 更新istio
使用istio-demo.yaml直接进行更新,修改以下内容,在现有的istio-demo文件中搜索更新 关键字,可以查看到修改的内容.
下载istio-demo.yaml 下载yaml.zip 下载istio.yaml
使用envoyFilter获取真是的sourceIP,问题在k8s在nodeport模式下使用了snat,无法获取哦sourceIP了.....
https://github.com/istio/istio/issues/7607istio/istio#7607
https://github.com/istio/istio/issues/7964istio/istio#7964
###更新: 设置获取请求的remoteIPhttps://github.com/istio/istio/issues/15236###
|
|
-
关闭mixer的证书检查
-
修改ingressgateway为NodePort类型
-
修改kiali configmap的grafana的url
-
更新kiali,grafana,prometheus,tracing为NodePort,并指定端口
-
更新policyCheckFailOpen: true,允许"失败打开"策略,当Mixer Policy Pod无法响应时,所有的请求会成功,而不是报503错误
-
更新interceptionMode: TPROXY 用于处理sourceIP的获取,目前还存在bug
-
更新:prometheus申请的CPU和内存,修改频率限制
-
设置pilot的环境变量PILOT_ENABLE_FALLTHROUGH_ROUTE: 1(1.1.4默认) -
更新: 增加mixer的资源为1核1G
-
设置istio grafana面板中,"editable": true, 实际无法保存,主要是看看参数配置.
-
更新完成之后,现在正在运行的pod,deployment,service不会更新proxy,需要手动更新,会偶尔出现No healthy upstream的503错误
-
配置更新grafana,主要是Email告警和MySQL数据库
-
所有的Deployment设置更新策略,maxSurge: 1,maxUnavailable: 0,用于热升级istio,避免升级期间502!!!
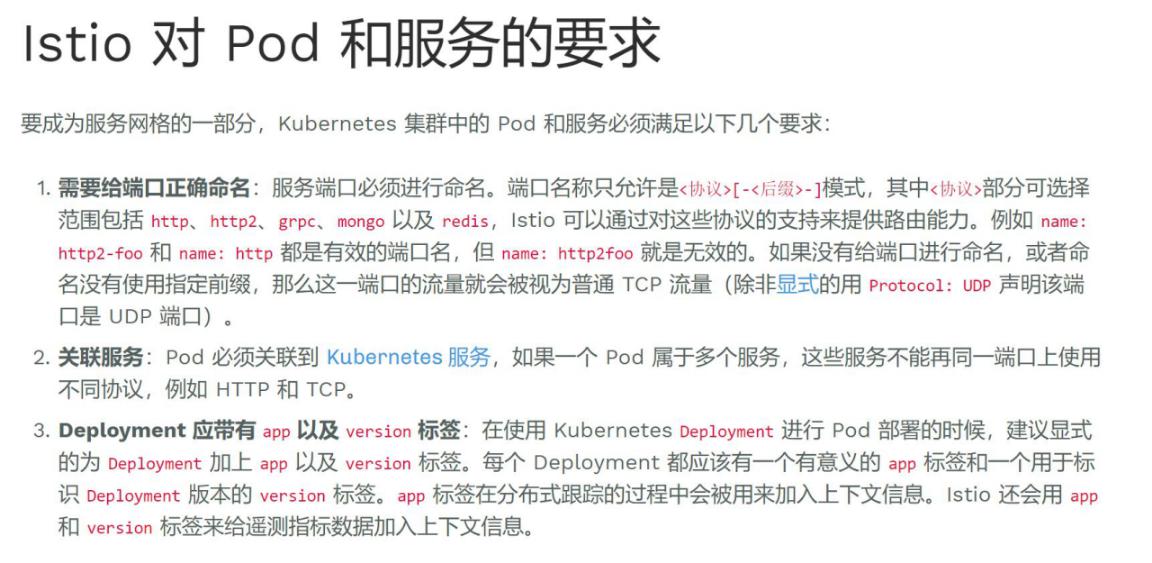
4. Istio对pod和服务的要求
https://istio.io/zh/docs/setup/kubernetes/spec-requirements/
https://istio.io/zh/help/faq/traffic-management/
为利用 Istio 的路由功能,Service的端口名称必须是 protocol-suffix 形式,其中protocol 可为 grpc,http,http2,https,mongo,redis,tcp,tls,udp.
例如,name: http2-foo 或 name: http 是有效的端口名称,但 name:http2foo则不是.
如果端口名称以不识别的前缀开头,或者端口未命名,则端口上的流量将被视为普通TCP 流量(除非端口明确指定了使用协议,例如: protocol: TCP).
Deployment中的 template.metadata.labels必须有app和version标签
Nginx的示例如下:
|
|
5. 自动注入SideCar
https://istio.io/zh/docs/setup/kubernetes/sidecar-injection/
|
|
|
|
###如果想单独控制Deployment,可以配置annotations###
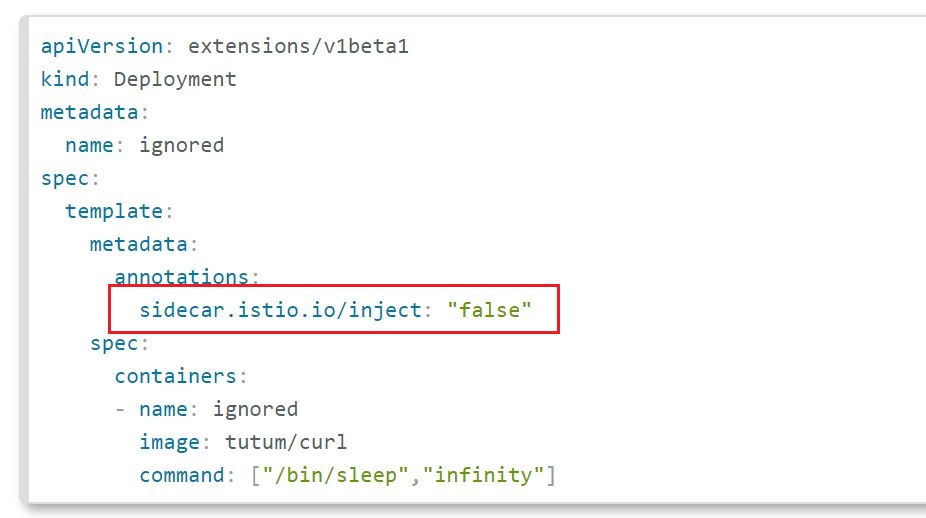
自动注入是自动注入到pod,不会反应到Deployment,手动注入可以通过kubectl describe deployment -o wide 查看,会多一个proxy的pod
###手动注入###
|
|
###兼容历史环境,默认不自动注入sidecar,有sidecar.istio.io/inject: "true" 的才自动注入sidecar###
|
|
6. 流量控制
6.1.控制流程
https://istio.io/zh/docs/reference/config/istio.networking.v1alpha3/
https://istio.io/zh/blog/2018/v1alpha3-routing/
https://istio.io/zh/docs/tasks/traffic-management/
https://stackoverflow.com/questions/52402376/istio-proxy-does-not-intercept-outgoing-traffic-with-global-proxy-includeiprange
https://my.oschina.net/wenzhenxi/blog/2980821
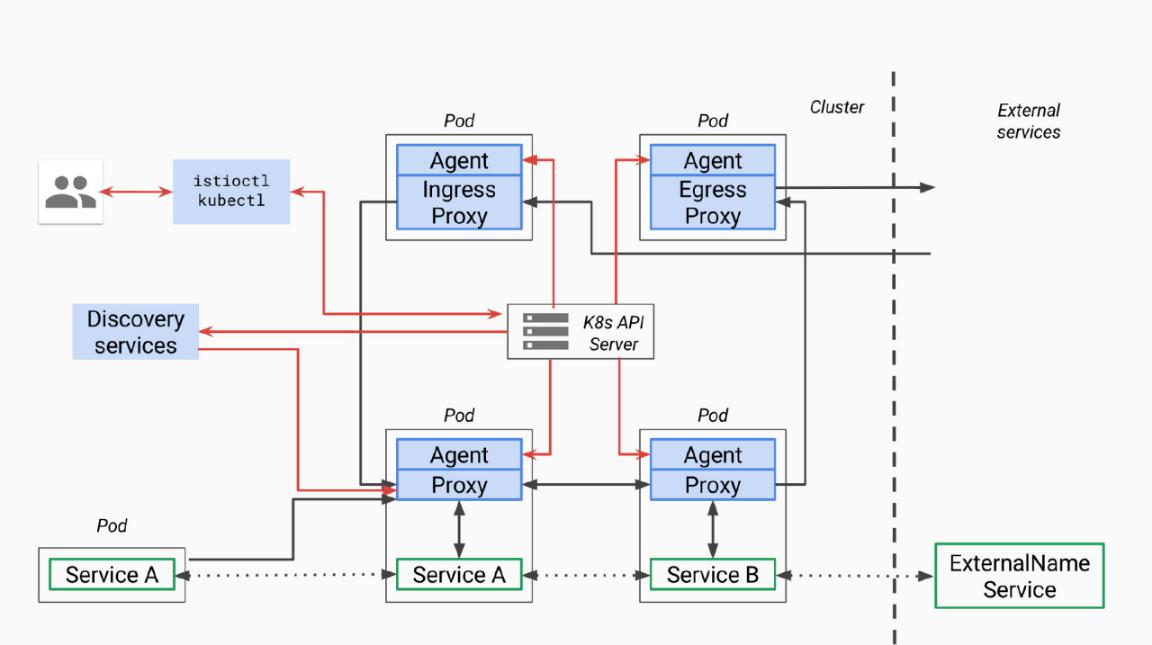
图例说明:图中红色的线表示控制流,黑色的线表示数据流.蓝色部分为和Pilot相关的组件.
提供Pilot相关的CRDResource的增.删.改.查.和Pilot相关的CRD有以下几种:
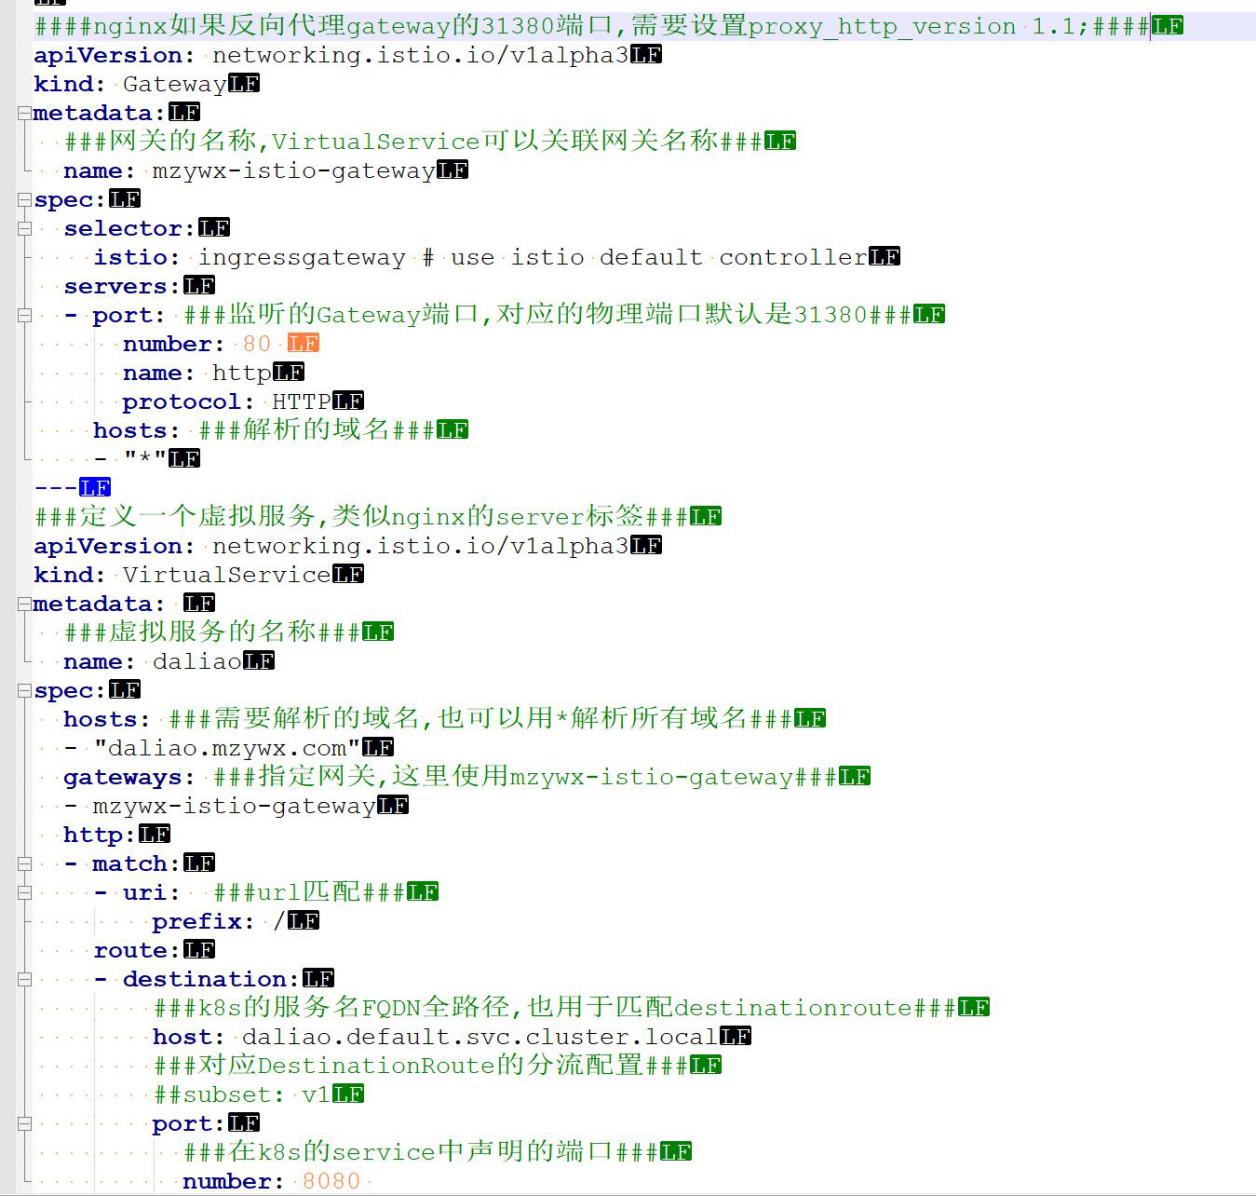
Gateway:为网格配置网关,以允许一个服务可以被网格外部访问.处理L4--L6层协议,例如域名和SSL证书等,类似nginx的http/server标签,作为全局的处理
VirtualService:用于定义路由规则,例子不同服务版本之间分拆流量.处理L7层协议,类似Nginx的location标签.需要指定Gateway,通过route.destination.host关联DestinationRule.
DestinationRule:配置将流量转发到服务时应用的策略集及可路由子集.策略包括断路器.负载均衡以及TLS等.通过Host关联K8s的Service,同时也对应VirtualService的Host.
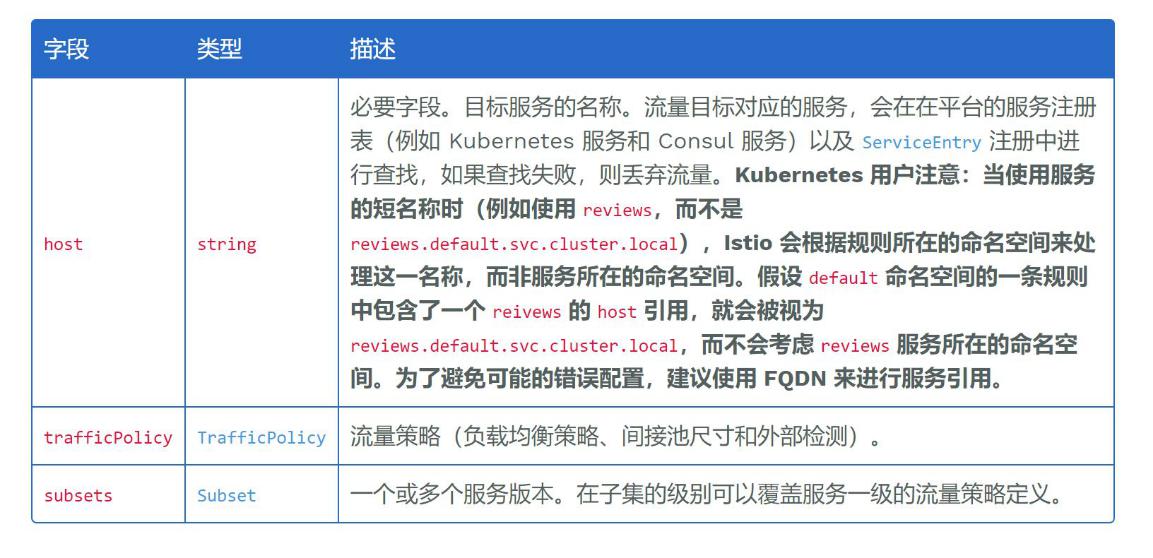
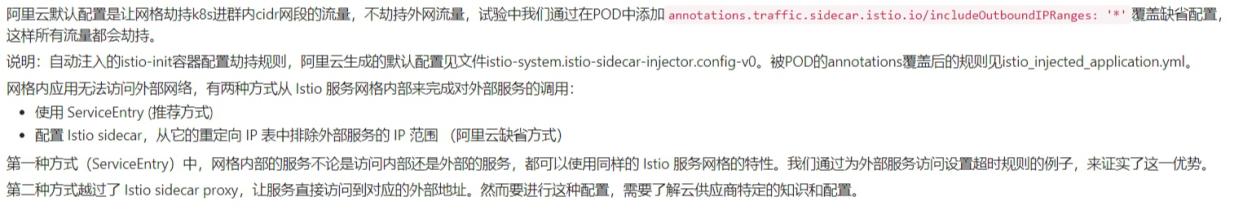
ServiceEntry:用[ServiceEntry]可以向Istio中加入附加的服务条目,以使网格内可以向Istio服务网格之外的服务发出请求,定位和DestinationRule类似,只是处理出口流量.
EnvoyFilter:可以为Envoy配置过滤器,通过EnvoyFilter启用Lua过滤器,动态改变Envoy的过滤链行为.这一功能一定要谨慎使用.错误的配置内容一旦完成传播,可能会令整个服务网格进入瘫痪状态.
6.2.通信路由
https://preliminary.istio.io/zh/docs/reference/config/istio.networking.v1alpha3/#httpmatchrequest
https://preliminary.istio.io/zh/docs/reference/config/istio.networking.v1alpha3/#virtualservice
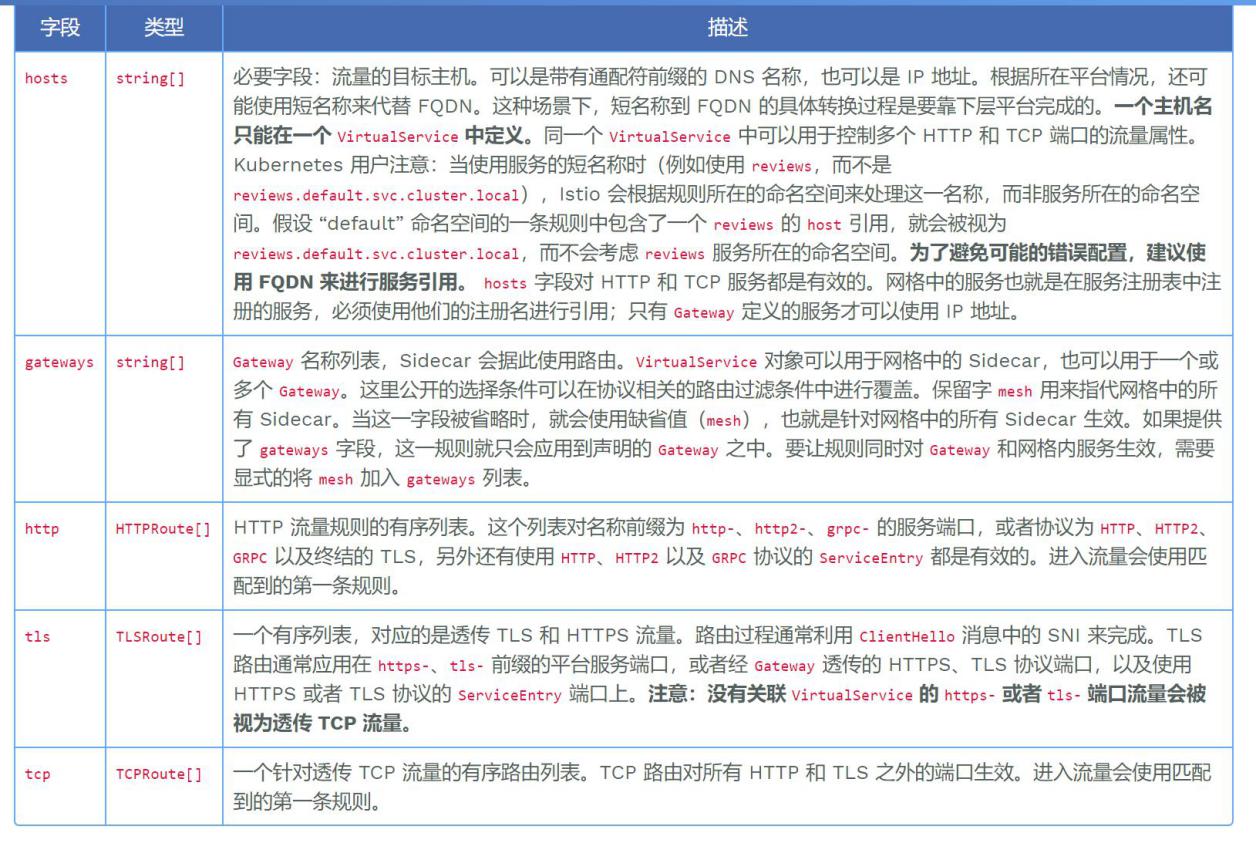
一个主机名只能在一个VirtualService中定义
如果只需要外部访问,需要显示配置gateway,如果需要内部外部都能访问,还需要gateway增加mesh这个内置的gateway.
下载istio-gateway.yaml 下载VirtualService.yaml
6.3.出口流量
默认是全部放行的.单独制定放行策略的时候,http协议只需要ServiceEntity,HTTPS协议还需要声明VirtualService
###放行微信常用域名的例子###
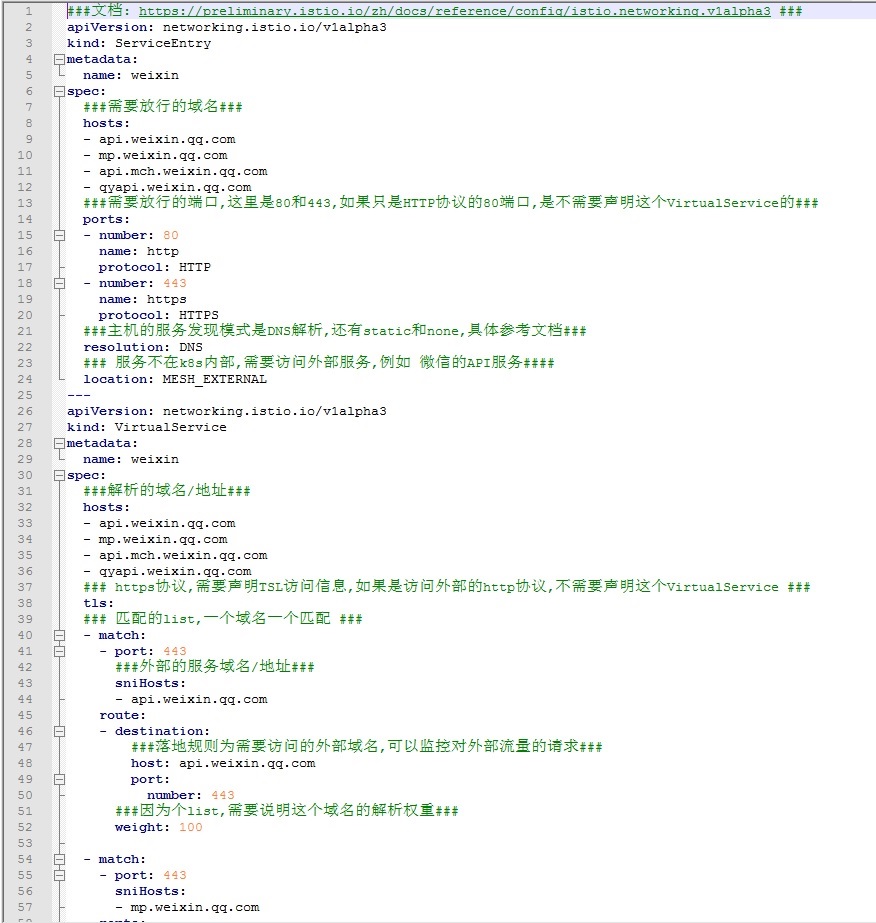
weixin-ServiceEntry.yaml
如果是自定义控制访问限制,需要修改deployment中的设置
|
|
https://github.com/istio/istio/issues/12952istio/istio#12952
6.4.运维指南
https://preliminary.istio.io/zh/help/ops/traffic-management/troubleshooting
如果部署了 istio-citadel,Envoy 会每隔 15
分钟重启一次,来完成证书的刷新任务.这就造成了服务间的长连接以及 TCP
流的中断.
禁用istio-citadel
kubectl scale --replicas=0 deploy/istio-citadel -n istio-system
istio 1.1版本已经修改了证书的方式,不存在这个问题了.
MySQL无法连接:
https://github.com/istio/istio/issues/10062
kubectl delete meshpolicies.authentication.istio.io default
sidecar和mysql在同一个pod里,对于mysql是locahost主机的账号登陆,
应该是istio没有处理好或者是不兼容MySQL协议造成的.不能获得请求的远程主机ip
mysql的数据库连接是有事务的,envoy代理的时候只是保证了和client的长连接,和mysql的连接会超时重建,造成数据库事务异常,因为有事务的连接被envoy释放了,mysql暂时禁用了istio的sidecar.
|
|

false就是没有禁用,启用状态.
istio.yaml 默认是true,禁用策略预检查
istio-demo.yaml 默认是false,启用策略预检查.
建议true,禁用策略的预检查,提高性能
7. 获取客户端真实IP
参考: https://blog.csdn.net/mailjoin/article/details/79686979
要让 pod 能正常获取客户端ip大致有如下几种方式:
-
可以使用 NodePort + {"spec":{"externalTrafficPolicy":"Local"}} 的配置来实现.
-
还有个解决思路就是利用 INGERSS.INGRESS 本质上是监听物理机端口,然后直接将客户端请求转发至service.可以在INGRESS 请求转发阶段将客户端IP 带到请求头中.
-
pod直接使用 HOST 网络模式.
第三种方式最便捷,但容易造成端口冲突.安全问题也有待考量,因此不推荐.
第二种方式最灵活,即使pod分布在不同node上也可以通过统一入口访问,官方INGRESS是由nginx实现的,这样一来花样就多了(甚至可以做流控,认证功能).推荐使用.
第一种方式折中,但是service只能在固定IP上解析了,不能做任意ip访问了.
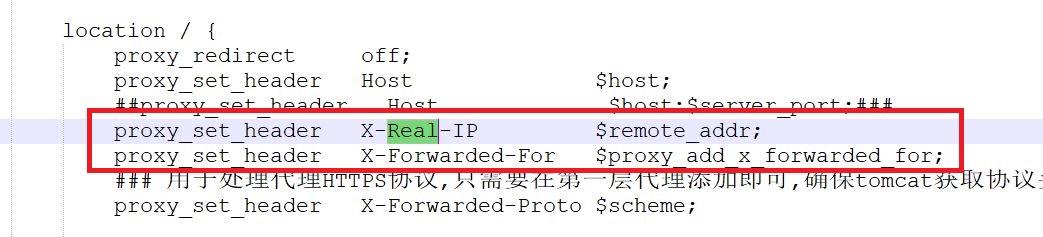
Istio的GateWay是基于K8S的Ingress实现的,正常是不会丢失IP的,但是直接访问GateWay,header里没有x-forwarded-for和X-Real-IP,所以pod无法获取访问者的真实IP.需要在前面做个代理(例如Nginx),设置一下header里的x-forwarded-for和X-Real-IP.
GateWay会把header转发到pod,就能获取访问者的真实IP了.
如果还是无法获取,尝试设置
proxy_set_header X-Forwarded-For "$proxy_add_x_forwarded_for,";
8. 遥测
还需要处理这些组件的数据持久化
+--------------+--------------------------------+-------------------------------+ | 插件模块名称 | 用途 | 地址 | +==============+================================+===============================+ | Grafana | 可视化数据展示 | http://10.0.8.28:32032 | +--------------+--------------------------------+-------------------------------+ | Prometheus | 监控&报警&时间序列数据库的组合 | http://10.0.8.28:32033 | +--------------+--------------------------------+-------------------------------+ | tracing | 分布式追踪 | http://10.0.8.28:32034 | +--------------+--------------------------------+-------------------------------+ | kiali | 显示流量拓扑图 | http://10.0.8.28:32035/kiali/ | | | | | | | | 账号 admin 密码 admin | +--------------+--------------------------------+-------------------------------+
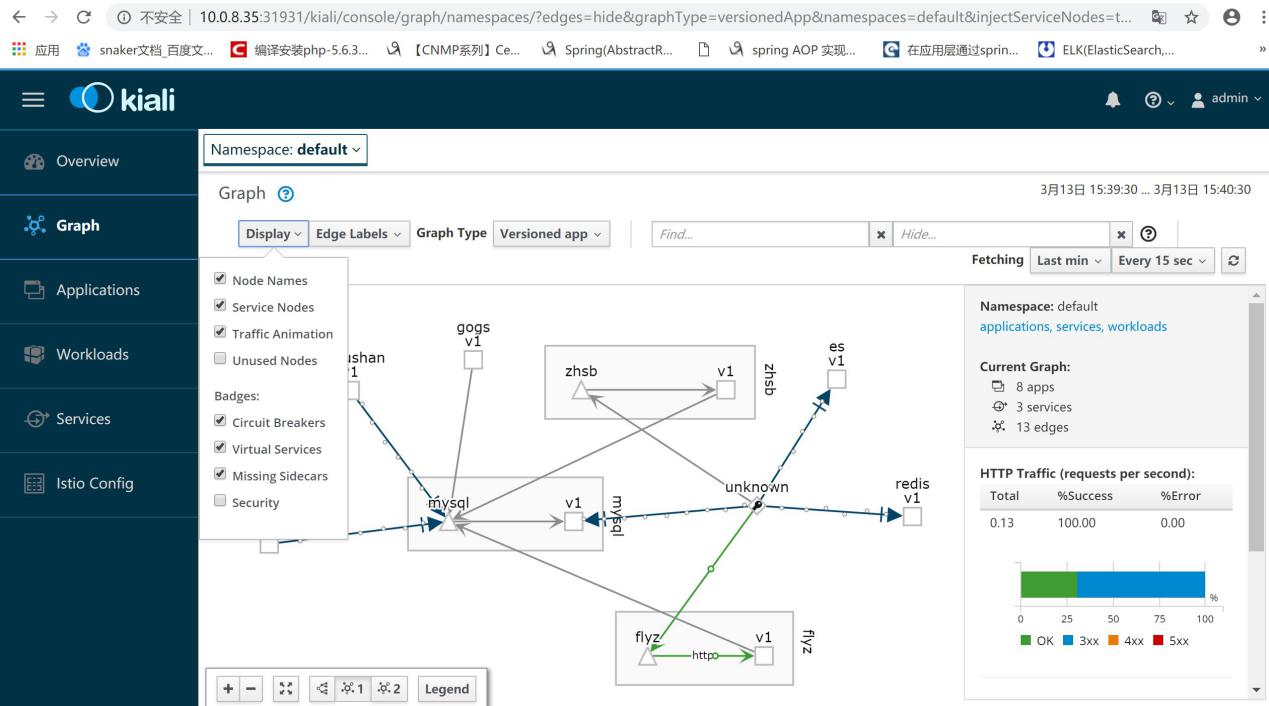
8.1.Kiali服务拓扑
istio默认已经安装了kiali
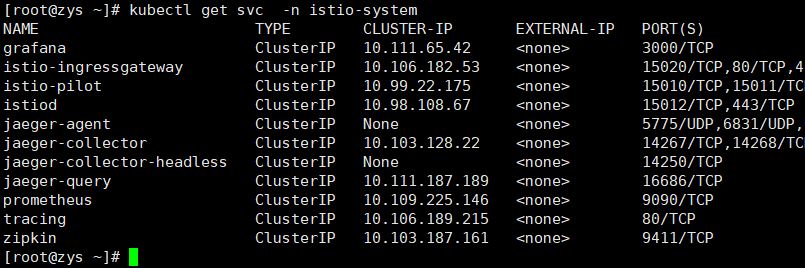
查看service
kubectl get svc -n istio-system
默认是ClusterIP的方式,修改成NodePort,就能使用端口访问了
例如 http://10.0.8.28:31931/kiali/
账号 admin 密码 admin
8.2.分布式追踪
https://istio.io/zh/docs/tasks/telemetry/distributed-tracing/
###查看tracing的pod,默认使用的是jaeger###
###执行端口映射###
|
|
建议修改 service tracing 为 NodePort 方式,比较方便
###访问查看跟踪###
浏览器访问 http://10.0.8.28:31553
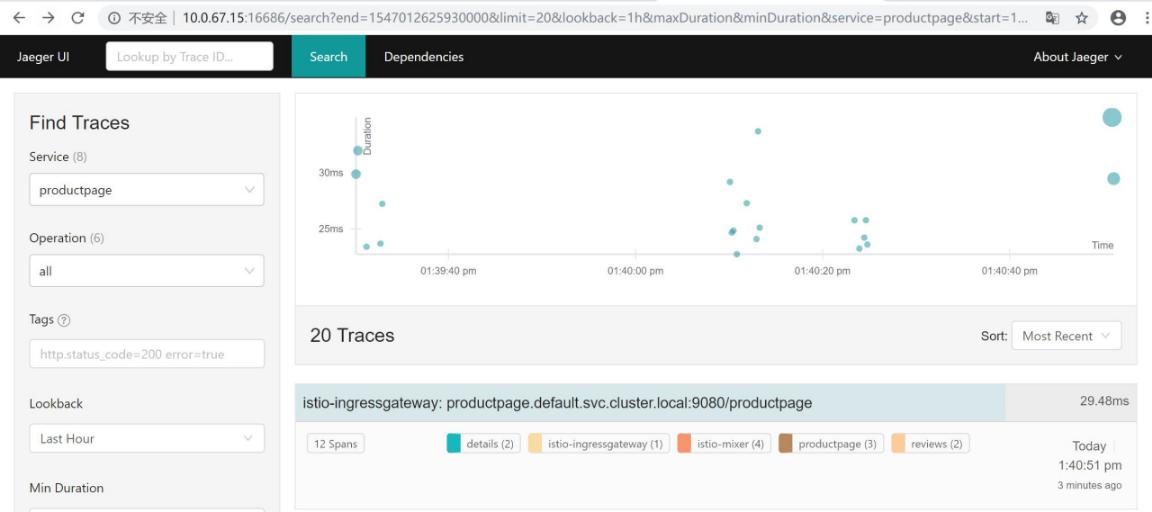
###每次请求服务的耗时###
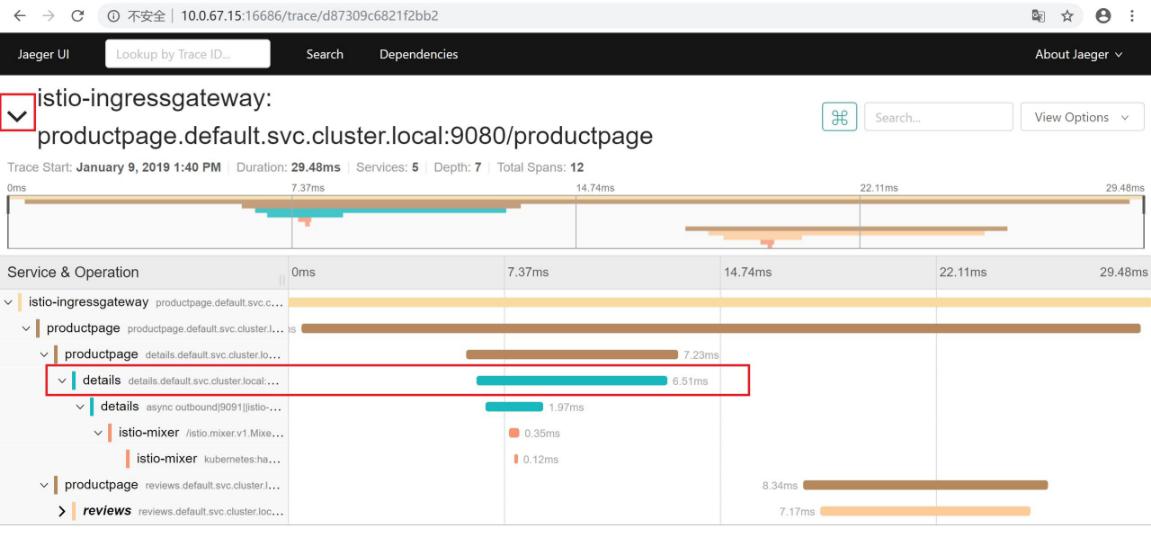
###处理header头###
虽然Istio代理能够自动发送Span信息,但还是需要一些辅助手段来把整个跟踪过程统一起来.应用程序应该自行传播跟踪相关的 HTTP Header,这样在代理发送Span信息的时候,才能正确的把同一个跟踪过程统一起来.
为了完成跟踪的传播过程,应用应该从请求源头中收集下列的 HTTP Header,并传播给外发请求:
|
|
在对下游服务进行调用的时候,就应该在请求中包含上面代码中获取到的HTTP Header.
需要处理WEB接受请求之后,GRPC请求服务的时候,加上Header.这就是标准的力量......
8.3.Prometheus指标
https://www.qikqiak.com/k8s-book/docs/52.Prometheus%E5%9F%BA%E6%9C%AC%E4%BD%BF%E7%94%A8.html
https://yunlzheng.gitbook.io/prometheus-book/
https://prometheus.io/docs/prometheus/latest/querying/functions/
https://github.com/kubernetes/kube-state-metrics/tree/master/docs
https://blog.csdn.net/qq_21816375/article/details/80193426
prometheus是一套开源的监控&报警&时间序列数据库的组合.
envoy拦截请求>上报mixer>对接prometheus>grafana
Mixer 中内置了Prometheus适配器,这一适配器将生成的指标值以端点的形式公开出来;Prometheus插件则是一个预配置的Prometheus服务器,他一方面从上述Mixer端点抓取 Istio指标,另一方面还为Istio指标提供了持久化存储和查询的服务.
配置好的Prometheus插件会抓取以下三个端点:
istio-mesh(istio-mixer.istio-system:42422):所有Mixer生成的网格指标.
mixer(istio-mixer.istio-system:9093):所有特定于Mixer的指标,用于监控Mixer本身.
envoy(istio-mixer.istio-system:9102):envoy生成的原始统计数据(并从statsd转换为prometheus)
###查看服务###
kubectl -n istio-system get svc prometheus

###端口映射port-forward,和jaeger映射类似###
|
|
建议修改 service prometheus 为 NodePort 方式,比较方便
浏览器访问 http://10.0.8.28:31575
在网页顶部的 Expression 输入框中,输入文本:istio_request_bytes_count,然后单击 Execute 按钮.
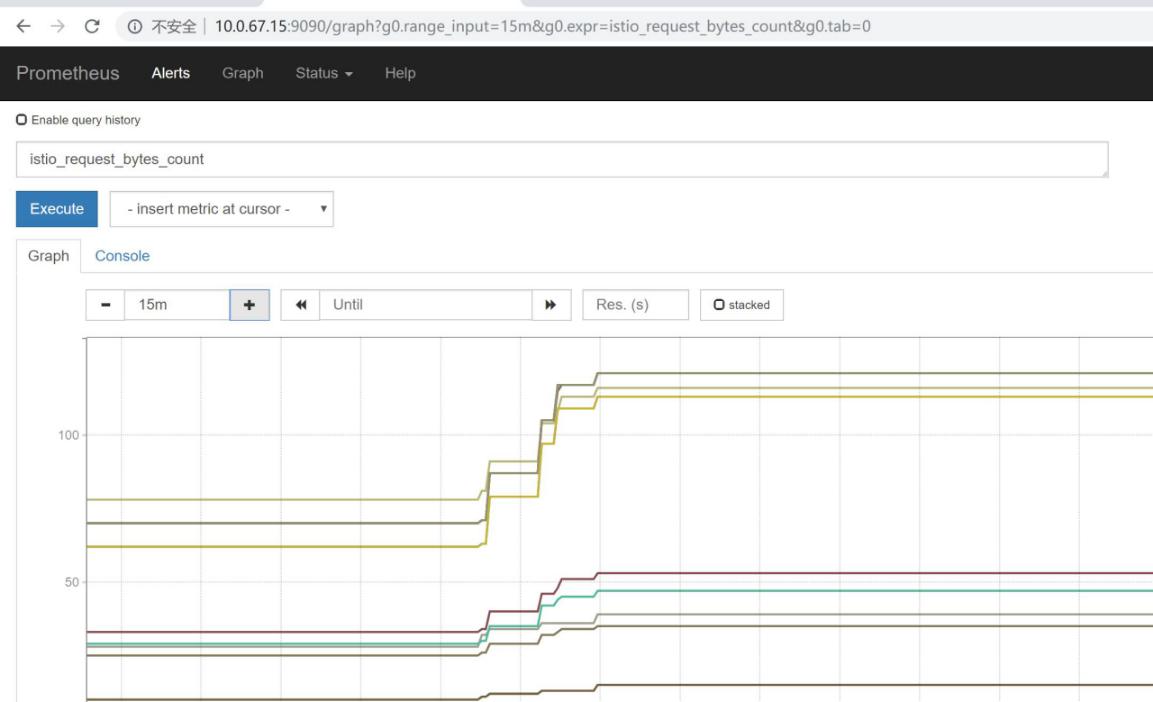
支持安装外围插件用于数据采集,我们主要用了node_exporter,kube-state-metrics和istio自带的metrics.
node_exporter使用DaemonSet方式运行.在pod中设置prometheus.io/scrape:
'true'
注解,istio自带prometheus中的kubernetes-pods配置自动采集(会无法获取nodeName,使用hostNetwork:true).
注释掉hostNetwork: true,不占用主机的9100端口
常用的监测项目:
|
|
配置文件:
promethues.zip
source_lable 类似于查询,多个source_lable是 and 的条件关系
|
|
查询到 __meta_kubernetes_service_annotation_prometheus_io_scrape=true的对象,确定一个操作的范围
8.4.Grafana可视化
https://preliminary.istio.io/zh/docs/tasks/telemetry/using-istio-dashboard/
###查看服务###
kubectl -n istio-system get svc grafana

###端口映射###
|
|
sql更新admin密码为admin:
|
|
建议修改 service grafana 为 NodePort 方式,比较方便
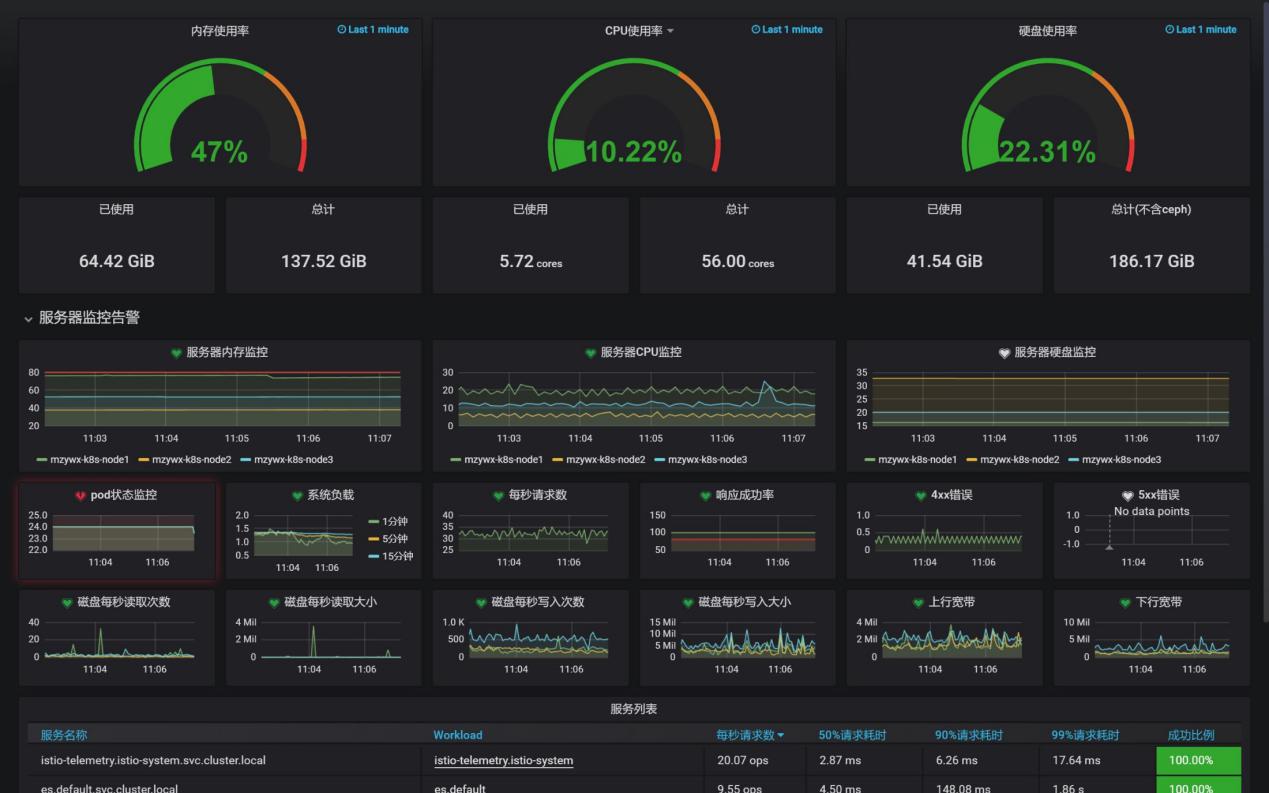
###查看 K8S集群监控 面板###
http://10.0.8.28:32032/d/Tl8II5Wmz/k8sji-qun-jian-kong
文章作者 springrain
上次更新 2019-07-11